Monday, February 6, 2012

Complex Simple Machine

I have chosen corkscrew.


This one contains 2nd type of levers on the handle, wheel on the other handle, and screw on corkscrew.

Here's a diagram


Mechanical Advantages of second Lever =  Force output/Force input = Distance input/Distance output = 12cm/2cm=6
Mechanical Advantages of screw = 2πr/l = 2π/2l = 2π/(2*8.5) = π/8.5 = 0.369599
Mechanical Advantages of wheel = Force output/Force input = Distance input/ Distance output = ((2+19)*2*π*(270/360))/(2*2*π*(270/360))=21/2=10.5

Conclusion: corkscrew is designed to make a person to remove the cork stopper easily. It seems like it is make to make a person to use minimum amount of force by maximizing the distance. However, when screw is applied to the calculation, it went some kind weird. People have to actually use lots of forces to make a hole in the cork stopper with screw. The reason why people designed this way is to make a person use less force during the removing, not during making hole. Other than that, what i expected was right. For the Lever, I had to divide Distance input by Distance output which is pretty simple. And for the wheel, i have to divide the radius of input by radius of output which is also simple. MA of screw was messed up since i had to use totally different equation, and i haven't learn it.

Labels: , ,

Sunday, October 30, 2011

MTC Designing Lab

Intro
  This lab is to produce a fancy car that works with the engine(mouse trap) and some trashes that can be found in house. Ridiculously, our car must be in our own design and go farther than 5 m in order to get an A. Therefore, i had to pick an special design that no one uses it but i had to take a risk that it wouldn't go further

Hypothesis
   As the mouse trap on the top pulls the string, it rolls the wheel about 12 times; which the car should go a little bit more than 5m.

Working as a Group
  Since I wasn't live close to Christy, I had to call guardian to go all the way to her house. on Saturday and Monday, I went to her house and worked on the car together. Even though i had to do all dangerous jobs, such as making an holes on the can, or cutting the can, Christy helped me on making wheels and setting mousetrap.

Design
  Our design was the best of all class works since the monster can, duct tape, and the huge wheels made perfect harmony and no one's car looked like my car.

Relevance
  since ours in light and has huge head, air resistance was huge. Moreover, the cap was off when we did the trials so the air resistance would be worse.

Adaptation
  Well, I don't think i have used any physics in this lab. More likely my mouse trap car moved with the math: the length or the wheels' perimeter will be bigger than 5 meters. The only physics that I could use was the force of friction since I minimized the friction between the car and the ground by making the car light and the air friction by tilting it about 30 degrees.

Conclusion
This time, I focused too much on the design of the Car, so if i have another chance to make the MTC, I would simplify my design and make it to go way farther than my previous one.

Data


1st run
2nd run
Displacement (exhausted trap)
14.3 m
13.6 m
Time (exhausted trap)
13.7 s
13.5 s
Displacement (total)
15.1 m
14.5 m
Time (total)
14.7 s
14.4 s
Mass of car in kg
.4 kg
.4 kg
Calculated max velocity
2.09 m/s
2.01 m/s
Calculated Average acceleration
.15 m/s^2
.15m/s^2
Calculated Average deceleration
-2.72 m/s^2
-2.26 m/s^2
Calculated Force and Coefficient of Friction
1.08, .275
.904, .230
Calculate the spring’s applied force
1.08
.904
Calculate Work done
16.3
13.1
Calculate the power generated
1.11
1.12


Those two are previous model
Group Picture
Picture of me with the latest model of the car
(where is my lab partner lol)

Sunday, October 16, 2011

Design a lab Trajectory

Hyun
Kim, Christy, Rin
Physics, Blk 2
Mr. Elwer

Introduction : As human trow a ball, brain automatically calculate the angle and throw in a hyperbolic path so that the ball goes to exact spot. Hyperbolic path of the projectile provides lots of information: launching angle, initial velocity, maximum height of projectile, total displacement when the object first hit the ground. Lots of other information can be derived from these information. Students should be using trigonometric equations and bunch of physics equations to calculate all the measurements. The purpose of this lab was to get the initial velocity of projectile and the angle that is has been thrown with when we were given the length, the angle of the projectile form a observer who is 7m apart from the projectile. From this lab, we would be able to get the angle of the projectile when it was thrown, and initial velocity that ball possesses.

Materials : To compete this lab, we need: Mr. Elwer(as a pitcher), couple cones, tape measure, couple student with angle gun, and balls.

Experimental Design : On this lab angles that students measure and the total displacement of projectile will be crucial because as those independent variables change, dependent variables such as angle of projectile and initial velocity will change. To do this accurately Mr. Elwer and angle observers shouldn't be moving, and someone should measure the distance pretty accurately by putting cones exactly where projectile hit the floor.

Procedures :
     1. Go outside to find enough space
     2. Place Mr. Elwer on a position, angle observers, and a student who will record the displacement
     3. Throw the ball, measure the displacement, and angle of maximum height of the ball.       *make sure thrower do the overhand mother and angles are between 20' to 70'.
     4. Repeat 3 couple times so that we can get the accurate data.


Date Table :


Trial #
Angle (')
Distance (m)
1
32
15.9 m
2
38
14.5 m


1st Trial:
Minimum distance between observer and the path of the projectile = 7m
Height of Thrower and Observer = 2m
Angle of angle gun = 32
Displacement = 15.9
Acceleration from gravity(a) = -9.81
Velocity of Projectile in y direction when it hits the maximum point (Vyf) = 0

Total Height of the Projectile when it hits the maximum point = 2+7*tan(32)
h = h+ vit + at2/2
7tan32=(9.81)t^2/2
t=.944331=.94s
Vyf=Vyi+at, 0=Vi+(-9.81)*t
Vyi=9.26388=9.3m/s
Vx=d/t, Vx=15.9/(.944331*2)=8.41866=8.4m/s
use pitagorian theorem Vi=sqroot(Vx^2+Vyi^2)=12.5177=13m/s
angle=arctan(9.3/8.4)=48'

2nd Trial
Total Height of the Projectile when it hits the maximum point = 2+7tan(38)
7tan38=(9.81)t^2/2
t=1.05593=1.1s
0=Vi+(-9.81)*t
Vyi=10.3587=10.m/s
Vx=d/t, Vx=14.5/(1.05593*2)=6.866=6.9m/s
Vi=sqroot(Vx^2+Vyi^2)=12.4275=12m/s
angle=arctan(10/6.9)=56'
Graphs :
Time vs Position
Conclusion : Mr Elwer was throwing the balls with about 50 degrees and with about 12m/s. this tells that we could get the initial velocity of projector and angle from height of the object's maximum height. However, this lab can show me huge error because, as people use the angle gun, there can be huge error. to improve this problem, we can buy a new, fancy, and expensive machine to measure the angle, otherwise, we have to go over the procedure over dozens of times.

Labels: ,

Monday, September 19, 2011

Lab #2 Acceleration on an Inclined Track

Hyun Choi
Christy Kim, Rin Enatsu
Physics, Block 2
Mr. Elwer

1. Introduction

Background Information:
-- Constant acceleration is the constant change. Since the slope of tangent line of Velocity is equal to Acceleration, our constant acceleration slows down the velocity and make a function of position a parabola.

What concept is being explored/investigated
--The relationship between acceleration, velocity, and position is going to be investigated

Purpose of the experiment
-- Purpose of this lab is to figure out the relationship between position function, velosity function, and acceleration function

Hypothesis
-- Graph of position fuction should be parabola since the constant acceleration affects Velocity to slow down the moving particle.


2. Material
1. PASPORT Xpolorer GLX
2. PASPORT Motion Sensor
3. 1.2 m PASCO Track
4. GOcar
5. Book

3. Experimental Design

Describe overall setup
-- First of all, we have to setup the GLX
      Connect the Motion Sensor to the GLX and put the range selection on the Motion Sensor to the 'near' setting. Now, power up the GLX and open graph that is based on position (m) by time (s)
-- Secondly, we have to setup the equipment
      Install the PASCO track on the block or book so that it inclines a bit, and place the motion sensor on the top of the track. If your track is ready, place GOcar at the bottom of the track, and make sure sensor is facing the GOcar. Then, push it with little amount of velocity so that it comes back to it's place without touching the sensor.
-- Now we have to collect our data
   Before we get started, two students cooperating by one person pushing the car and one person press the button on the GLX makes the recording much easier
      Press start button on the GLX so that it starts to collect data. Push the car toward sensor, and make sure cart don't collide with sensor. If your graph is drawn perfectly, then press the start button once again to stop recording. Now your graph is there.
-- Interpret and analyze
  ※ We need to draw the velocity verses time graph and derive graph of the acceleration by measuring the slope of velocity graph. Next, we have to find the actual average value of the acceleration in the acceleration versus time graph.
      First of all, we have to connect the GLX to the computer and capture the position and time graph. After we copied the graph on the word, we go to sub-menu and select 'Velocity' now we will see the graph of velocity versus time graph. We also have to copy down the graph on the word. Now, on the velocity graph, press right or left button to move the cursor to the point where cart start to move. Press F3 and select 'Linear Fit'. After recording the value of the slope, you deselect 'Linear Fit'. Open the axis menu and select 'acceleration'. Use left, right button to move cursor to the beginning of the experiment, and select 'Statistics' and measure the average value of acceleration.

Data table
Item
Value
Acceleration (slope)
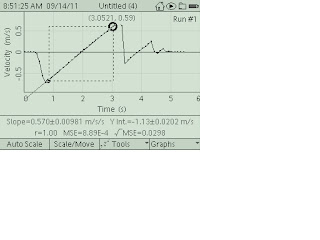
0.570±0.00981 m/s^2
Acceleration (avg)
0.5 m/s^2


Graphs 
Acceleration versus time

Linear Fit Graph

Position graph

velocity graph
Conclusion
      Velocity was the instantaneous change of position and acceleration was the instantaneous change of velocity. Therefore, my hypothesis was correct since acceleration caused by gravity is constant as -9.81m*s^(-2), my velocity graph should be linear function and my position function should be parabola. However, since my GLX calculated to really useless decimal places, it had to be simplified by my hand. For this lab, I could not follow the instruction of the procedure and left out some graphs, so it would be better next time if i read through all instructions.
Questions.
   1. Describe the position versus time plot of the Graph screen. Why does the distance begin at a maximum and decrease as the cart moves up the inclined plane?
     the graph of the position function shows that the cart is moving back from a point, and it can be told that negative acceleration affected cart to convert velocity from positive to negative and therefor cart moves back.
   2. Describe the velocity versus time plot
     It changes it's sign, so it can be told that cart is moving to both direction
   3. Describe the acceleration versus time plot of the Graph display
     even though graph seems bumpy, it should be constant as -9.81
   4. How does the acceleration determined in the plot of velocity compare to the average value of acceleration from the plot of acceleration
     since we have to combine the secant lines of the velocity graph to determine acceleration, it is neither precise nor accurate. However, average value of acceleration is the sum of tangent line of velocity graph at all points, it is more precise and accurate.

Labels:

Sunday, September 11, 2011

Lap Report

Data


D
F
H
M
P
10
Length (cm)
4.3
5.5
7
7.5
7.6
10.1
Width (cm)
3.6
3.6
3.9
7.4
7.6
8
Tickness(cm)
3.5
3.6
3.9
4.3
3.8
3.7
Mass (g)
27.62
38.8
51.2
96
161.1
177


Block
M
P
F
10
H
D
Time (s)
.78
.585
.725
.60
.56
.47
Distance (m)
1
1
1
1
1
1


Analysis
1. Organizing Data


D
F
H
M
P
10
Volume (cm^3)
54.18
71.28
95.83
238.65
219.488
298.96


2. Analyzing Data
    a. 10.1-4.3
         =5.8
    b. 298.96-54.18
         =244.78
    c.  Multiplying several length measurements together to find the colume will make the data less procision because the number of the sigfig will decrease as we multiply numbers. As it is inferred in the data and a. and b., data don't show any ratio.
3. Analyzig Data
    No; because we didn't do this lab in complete vacuum condition, acceleration, resistace against air, and velosity of objects would be different.
4. Constructiong Graphs


Block
M
P
F
10
H
D
Time (s)
.78
.585
.725
.60
.56
.47
Distance (m)
1
1
1
1
1
1


Conclusions
5. Drawing Conclusions


D
F
H
M
P
10
27.62:53.18
38.8:71.28
51.2:95.83
96:238.65
161.1:219.488
177: 298.96

It can be inferred that ratio should be close to 1:2. but this data shows me that i have errors that changed my ratio. also it can be seen that if mass is increasing, than volume also increase except for block P
6. error can be maden when i measure the length, width, and depth. since human eyes are not maden to perfectly measure what is the length, quit few error can maden, and this will affect the data chart and volume. Moreover, when we were measuring the time for dropping blocks, there can also be few errors. First of all, our timer can show some error since we click the botton too fast or slow. secondly, since the area of the side that face the floor decide the resistance of air, there would be different measurement.

Extension
7. this experiment will show us about the timing that each students press the botton, and this explains the errors on the measuring the time

Labels: ,